

Hey Blasters, GC here! We are halfway through Max’s Cosmic Countdown and GC has a very special edible art project she wants to share with all you Blasters. Graphs are a visual way for people to understand numbers, so I thought it might be fun to take a look at our Valentine’s Day treats through a mathematical perspective. For today’s activity, we are going to learn how to make fun Valentine’s themed graphs using some of our favorite holiday candies!

What you will need:
-one box of candy hearts
-sheet of white or graphic paper
-markers
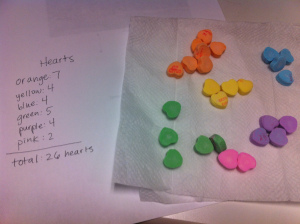
Before we start making our graphs, we will need to collect our data. Open your box of candy hearts and place them on a napkin. We will need to make some important observations. First, how many candy hearts were in the box? Second, make a note of which colors are in the box and how many hearts we have of each color. Now we are ready to start making our graphs!
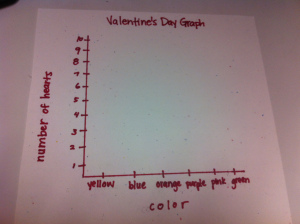
1. Create the shape of a capital “L” .
2. Label the sideways line “color” and the line going up and down “number of hearts”
3. Make labels on the “color” line for each candy heart’s color.
4. Place each candy heart in the correct spot.
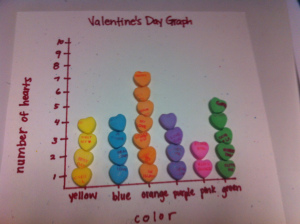
5. Now you can finally “analyze” your data and find out what your numbers mean!
6. For younger Blasters, find out which color had the most hearts in your box. For older Blasters, take things up a notch and calculate fractions that each heart makes for the total amount in the box!
You have now made a bar graph! If you want to show off your graph, lightly dabble some glue onto the hearts! Otherwise, reward your awesome math skills with a tasty snack! That’s it for today! Can’t wait to see what Monty has in store for us on Friday!
Filed under: Family Fun, graphing, holidays, Math Activity, valentine's day Tagged: | bar graph, Candy, candy hearts, GC, graphing, Math Blaster, max's cosmic countdown, valentine's activities, Valentine's Day, valentine's math


Leave a Reply